When we work with our agency clients on their Salesforce implementations, what we often see is that they’re successfully collecting a lot of prospect data in Salesforce, but have no idea how to use it to advance their business development efforts. They’re paying for a sophisticated business development tool, but using it as a glorified contact manager. In some cases they’re paying for a database they haven’t logged into for months or even years.
Building a dashboard that gives you insight into past performance and the current moment is one of the first steps to a successful Salesforce implementation. The dashboard is your Salesforce org’s value proposition. Without the ability to view key metrics at a glance, it’s doubtful your business development team will ever embrace Salesforce fully.
So how do you begin building the reports and dashboard you so desperately need?
Step One – Identify the Data
Determine which metrics are important to your business. Of course, if you haven’t been tracking anything at all to this point, you might have no idea what you want to see on your dashboard. Here are a few ideas to get you started:
- Sales revenue totals: You can view revenue numbers through a number of different lenses, depending on what’s important to your business. For instance, you could have a component on your dashboard showing you all the won opportunities for this fiscal year, broken out by service category. Or by sales person. Or by whether you sold to a new customer or an existing customer. The list goes on.
- Percent of sales goal attained: How are you tracking right now against your yearly sales goal? How is each sales person tracking against their individual goal?
- Win rate: Is your sales team as effective as you think?
- Marketing ROI: Which marketing efforts created the most sales opportunities? Which marketing efforts led to the most closed business?
- Top lead sources: Where are your new leads coming from?
Step Two – Build Your Reports and Dashboards
In the video below, I take you through building one example report and dashboard component. I build a report that shows me all of my closed won opportunities for this year. I then use that report as the source for a gauge component on my dashboard, so I can see where I stand in comparison to my yearly goal.
If you need more training on the report and dashboard builder, there are a number of great resources in the Salesforce Success Community.
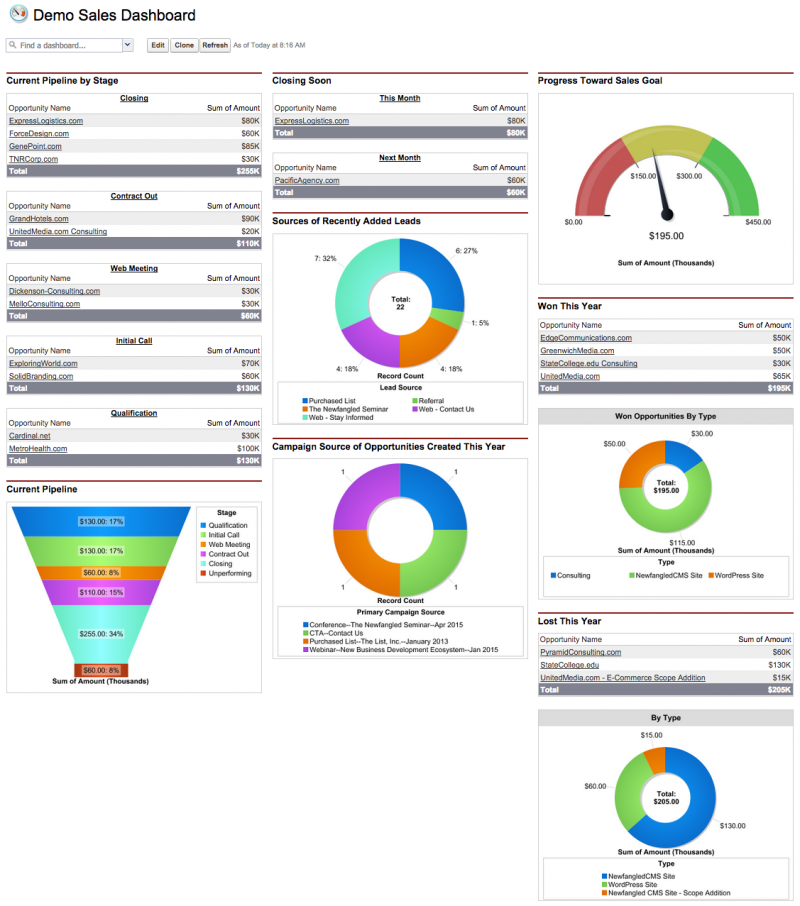
In the end, your dashboard might look something like this:
Step Three – Identify Data Gaps
Now that you have your reports and dashboard built, it should be a lot clearer where there are gaps in your data. Perhaps your report on Primary Campaign Sources didn’t yield any records, because your sales team isn’t consistently using that field.
Use your dashboard and reports to put together a guide for your sales team on which fields are important to use (and how to use them properly), so you can close those data gaps going forward. Once you’ve shown the team the dashboard and they see what metrics you can pull from Salesforce using the data they enter, they should be more than willing to implement your guidelines.
For suggestions on which fields are important for opportunities, see my blog post on tracking sales with Salesforce opportunities.
Step Four – Analyze and Optimize
Never stop refining. Your dashboard isn’t set in stone. Find time to review it in depth every few months, to make sure it still represents what’s important to your business and serves your team well.
Have suggestions for other helpful metrics or questions about implementing your own dashboard? Let me know in the comments!
Related Posts
-
One of the biggest challenges we observe with clients implementing Salesforce (or any CRM) is…
-

If you’re a Salesforce administrator, one of your main concerns is data integrity. But for…
-
Is your agency thinking about using Salesforce? Paying for it but not using it? Using…