
Today I took a look at the tracking data for the newsletters we’ve sent out over the past year. I was initially interested in seeing how the tracking data might correspond to general categories or newsletter topics (i.e. tools, process, strategy, marketing, etc.), but I realized in trying to assign categories to the past 13 categories that they didn’t always line up quite right. There is a lot of overlap in topics. For example, in February and March of 2008, the newsletters were about Search Engine Optimization, which could fit in any number of different categories. The same is true for most of the others. So, I scrapped that approach and decided to just think about some of the top and bottom newsletters and what factors might have caused them to be that way.
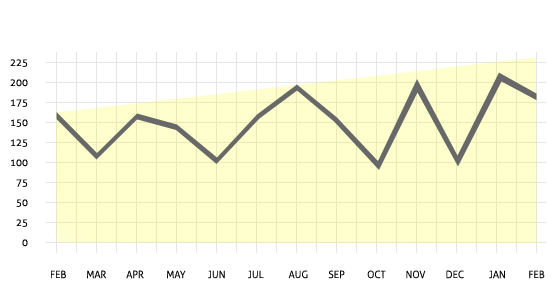
These tracking numbers reflect the number of users that clicked the ‘read more’ link in the email we send out and continue reading on our website. The yellow field behind the line graph indicates a general upward trend, even though there are dips along the way.
The least popular newsletter in the last year was from October, 2008 about online reputation management. This subject isn’t exactly a hot topic, and the term ‘reputation management’ is still a bit obscure, so it makes sense that this particular newsletter wouldn’t have drawn much attention. Another low-performing newsletter was from December, 2008, on evaluating when to adopt third party applications in the development process. Enough said on that. Not popular.
What about the high points? The top newsletter from the past year was from January, 2009, on how to use Google Analytics. I had a feeling that this would be a very popular one, since we’d publicly announced our switch from Urchin to Google Analytics to our clients in December, and analytics in general has become a very hot topic. The other top newsletter was from August, 2009 on how much work is a website? Even though the title for this one was pretty general, I think the question format made it a bit more compelling to readers.
Besides subject matter, there are other factors to consider when looking at this data. I’ve noticed that the time and day on which we publish a newsletter has a large effect upon how many people actually click through to read the full article. We’ve settled on Tuesdays at 10am as the best release time. I have a feeling that our December newsletter also fell victim to holiday distraction, too.
I’d be interested in knowing what subjects our readers would be interested in seeing covered in future newsletters. I have an editorial calendar that I use to plan out topics in advance, but I’d love some feedback on what topics to add in.
Related Posts
-

Christopher Butler will be a keynote speaker at the 2015 ConvergeSE conference...
-


Chris Butler will be speaking at the concluding session of the AIGA's Web101 course...
-
Chris Butler is MC'ing at this year's Hopscotch Design Festival...