
I’ll start by tracking this meme, as I’ve encountered it:
Buckminster Fuller’s Dymaxion Chronofile → My Life Bits → The Quantified Self: You Are Your Data → The Quantified Self Blog → Quantified Selves Wiki → Wehr in the World: Tracking Myself
The last “quantifying self,” (Wehr) who just happens to be nearby (from Durham, NC), writes:
“With all these data that I can merge together by day, I can build a huge data set that, with time, will have lots of predictive power and should allow me to learn things about myself that are not obvious at the surface.”
We’re trying to do the same thing with our internal resourcing tools. We’ve integrated our timesheet system with the rest of our admin tools, which allows me to query our database to get up-to-date statistics on how much time everyone on staff has spent on any account, and break up the report by person or category. This is obviously helpful when trying to determine if we are still within budget on a project, but we can also use it for predictive purposes, too (just like Wehr can personally). In fact, it was this kind of data that helped us to adjust our project pricing by adding percentages to account for the amounts of time spent by project management staff – we saw that project managers were consistently spending an additional 10% of the project budget once a site went live in order to deal with final tweaks, adjustments and other kinds of support. We now fold that in to the initial budget so we don’t have to nickle and dime our clients right after what should be a positive event- the go-live for a site.
Below is a visualization of my own time data from mid-October until today (I listed the breakdown by category underneath the graph). I chose mid-October because we started using a tweaked version of our system then, so I didn’t want to include a mix of data from the new and old system. This data is a bit skewed since I took a couple of weeks off for Christmas, but in general it shows a clear breakdown of my time across 14 different internal categories:
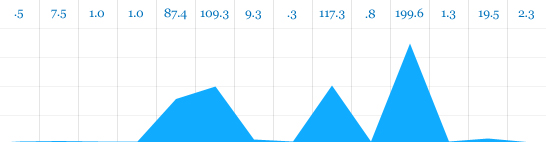
1. admin: .50 hours/0%
2. bug: 7.5 hours/1%
3. design application: 1.0 hours/0%
4. design creation: 1.0 hours/0%
5. off: 87.4 hours/16%
6. office: 109.25 hours/20%
7. prototype: 9.25 hours/2%
8. Q.A.: .25 hours/0%
9. resourcing: 117.25 hours/21%
10. sales: .75 hours/0%
11. service: 199.55 hours/36%
12. support: 1.25 hours/0%
13. upgrades: 19.5 hours/3%
14. whitescreen: 2.25 hours/0%
At first I was pretty surprised by the fact that I had logged 199.6 hours in the “service” category, but then I remembered that any internal strategic time I spend (writing newsletters, marketing, meeting with others about the direction of the company, blogging, etc.) is logged as service time toward our company (as apposed to a client). I dug a bit deeper and saw that about 90% of that “service” total is actually my Newfangled strategy time. This aligns much more with my sense for how I spend my time here.
Related Posts
-


Christopher Butler will be a keynote speaker at the 2015 ConvergeSE conference...
-


Chris Butler will be speaking at the concluding session of the AIGA's Web101 course...
-
Chris Butler is MC'ing at this year's Hopscotch Design Festival...