
This month, I’d like to use Newfangled’s new Website Management System as an example to examine the three areas I mentioned above, particularly focusing on advanced website measurement enabled by integrating with the Google Analytics API. I’ll also show a bit of what’s new in our latest release, as well as a preview of the upcoming project management tools within the system. Each aspect—content management, measurement, and project management—is critical to coping with the complexity of managing a website.
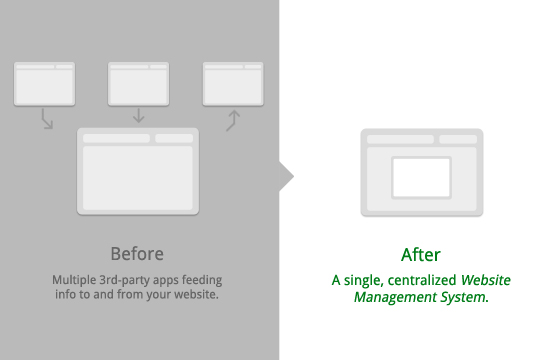
It may seem counter-intuitive, but my notion of truly advanced website measurement involves simplifying and centralizing the operation, rather than running two or more tools—your website content management system and other third-party analytics applications—in parallel. After years of practice, it has become clear to me that measurement in context is far more effective than not.
Centralized Measurement Tools
In our latest release of the NewfangledCMS, we took into account the need to simplify, centralize, and contextualize measurement tools. Thanks to the release last spring of the Google Analytics API, we have been able to deliberately move away from a model in which we rely upon small, third-party applications to round out the capabilities of a basic install.
One hallmark of the web 2.0 paradigm has been the proliferation of smaller, functionally limited but focused applications- things like PollDaddy for website user polls, Wufoo for customizable contact forms, or ShareThis for adding social media sharing tools to content. These small applications are still popular and in wide use- we even recommend them in some cases to our clients who need a fast solution and lack the budget to replicate the needed functionality within their websites. However, when it comes to measurement applications, our desire has been to fold in the most important aspects of those tools within the CMS, so that key metrics can be seen in context, as well as mixed with user-specific tracking data generated only by Newfangled’s custom tools.
Merging Google Analytics data with our data expands the scope of measurement, which is what makes it advanced, yet simplified. While Google Analytics is not able to report your rank on a particular keyword, anything particular about those who fill out forms and their browsing activity on your site, or which users by email are the most active users of your site, we can. Naturally, compiling this information with Google’s metrics is a profound expansion of measurement opportunity. We may be one of the first web development companies to take our software in this direction, but believe me when I tell you that the entire industry is moving in this direction. This shift expands the purpose of a content management system far beyond simply creating and editing site content, to adding in analytics, campaign and goal tracking, user-specific session data, and much more. Yesterday’s CMS is today’s Website Management System (WMS).
See the Big Picture or Narrow Your Focus, In Context
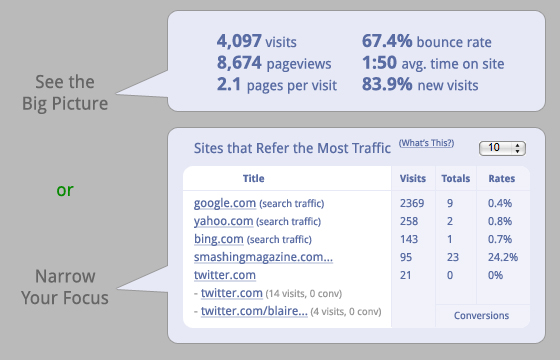
Our latest release includes a dashboard (more detailed images coming up on the next page) immediately upon login that delivers ten individual reports which we have identified as the most important metrics to follow on a regular basis. Half of these are basic reports derived from the Google Analytics API, while the other half are unique to our application, including keyword ranking, lead tracking, and most active session monitoring. As you can see from the image above, the reports are formatted in a way that makes a quick overview of the “big picture” just as easy as the ability to narrow in on something more particular, such as which referrers have the highest conversion rate.
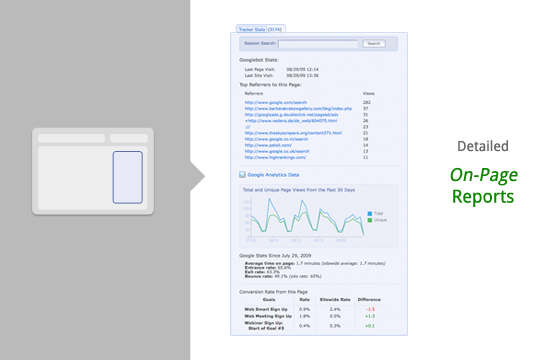
Additionally, this release includes wonderfully detailed reports that can be overlayed directly on each page, showing you when the page was last indexed, which sites refer traffic to the page, traffic rates, bounce rate, goal conversion rate, and even which phrases delivered organic search traffic to it. Having a report (like the one shown in the image above) literally inches away from your editing capabilities allows you to quickly make changes to your content in response to the conclusions you draw from real-time data. Again, more detail about the on-page reports can be found on the next page.
Now that I’ve described the concept behind this new website management system approach, I’d like to show you some of the dashboards features in more detail.
An Advanced Measurement Dashboard
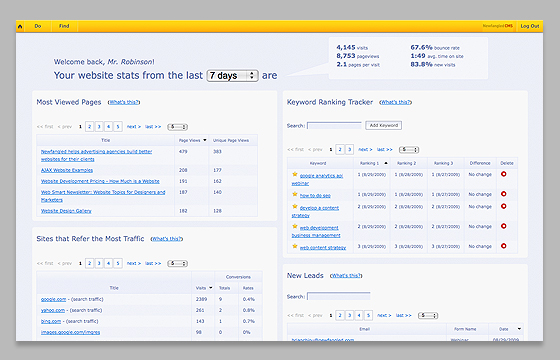
As I mentioned before, the dashboard (shown below) compiles what we’ve identified as some of the “greatest hit” reports from Google Analytics on the left side, while adding in new, custom reports on the right. The “greatest hit” reports we’ve chosen include most-viewed pages, referrers, search phrases, and visits-by-location maps. For the referrers and phrases reports, we added in a goal conversion column so that you could see which sources of traffic actually led to the goals you’ve identified in your Google Analytics account. The entire dashboard’s time frame defaults to the last 7 days, but can be altered to show various intervals including 2 weeks, 1 month, 2 months, 3 months, 6 months, or 1 year.
Because we’ve already looked at Google’s analytics reports in great detail in our newsletter on How to Use Google Analytics, I’m now going to focus on only those new reports on the right side of our dashboard.
Measure Your Keyword Ranking
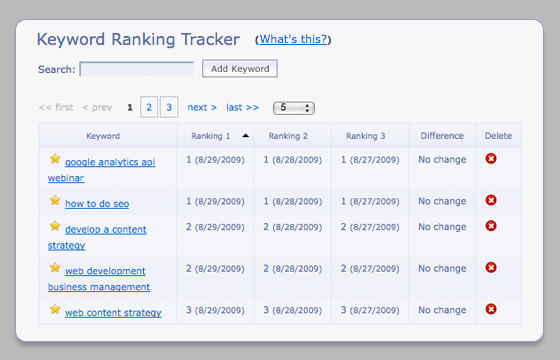
This report (above) is the most malleable one of the group- by entering a keyword that you’d like to track in the search field and then clicking “Add Keyword,” you can begin tracking your ranking for it immediately. We display three ranking columns, which will show any change in ranking over the last three days. If your ranking changes, the difference will appear in the fourth column as either a positive (in green) or negative (in red) number. You can stop following a keyword at any time by clicking the delete button in the fifth column.
Measure Your New Leads
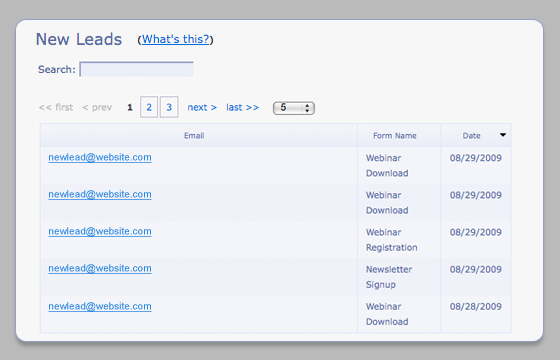
The New Leads report (above) shows the most recent leads captured by your site in reverse chronological order. By default, we show the last five, but you can expand that using the pulldown menu to show up to the last 25. You can also browse the list by using the paginated or “next” links to the left of the pulldown menu. Additionally, you can re-sort the list chronologically by clicking the arrow in the “date” column. By clicking an individual email address, or searching for an active address in the search field at the top, you will get a Lead Detail report (shown below) giving you much more information about that user.
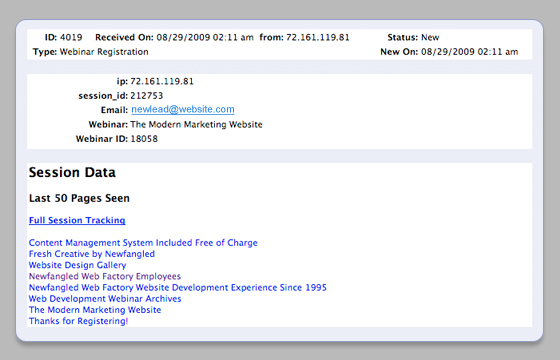
The Lead Detail report (above) tells you when the system first started tracking the user, what form captured the user’s email address (in this case, our webinar sign-up form), as well as which pages the user has browsed on the site. From the rundown of those pages, I can see that this new lead entered the site on a page about our content management system, viewed some example projects in our gallery, checked out our employees and our company’s history, responded to a call to action in our sidebar for our webinars, and finally chose to register for the upcoming webinar in October on “The Modern Marketing Website.”
Monitor Your Most Active Sessions
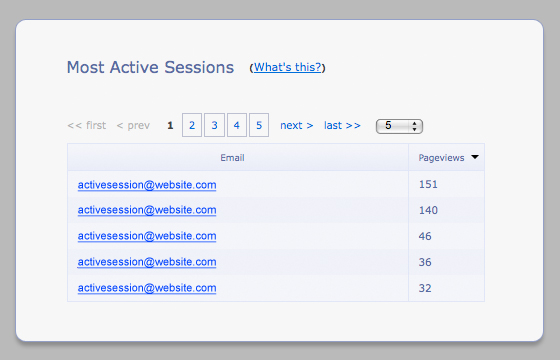
The Most Active Sessions report (above) shows the 25 sessions with the greatest number of pages viewed, tracked by email address. You can filter out specific email addresses or domains so that your or your employees don’t occupy the majority of the list. By clicking on a particular email address, you will get a Session Detail Report (shown below) giving you much more information about that particular user’s session.
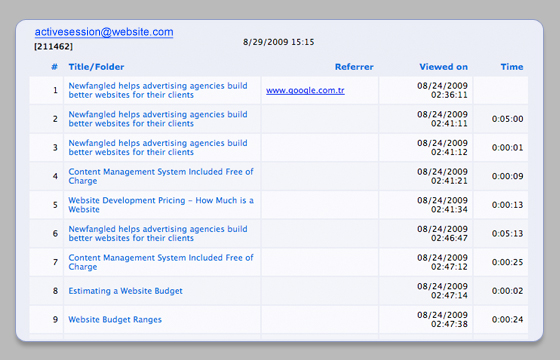
The Session Detail report (above) lists each page of a user’s session, starting from the point of entry to the most recent page viewed. The first listing will show a referrer if the page was not accessed directly (in the case above, the user came to our site from a Google search). The columns on the right will also tell you the dates and times of each page’s viewing, which is helpful in determining which pages were most interesting to a user. In this case, the user spent over five minutes on our homepage, probably viewing one of the videos featured there.
On-Page Reporting
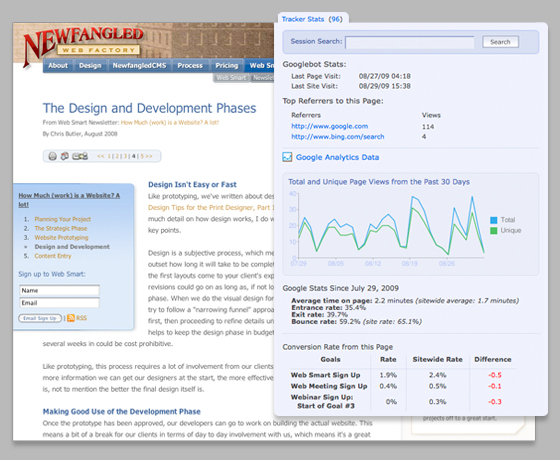
Unlike the reports I’ve just reviewed, which rely on data from custom tracking tools built by Newfangled, the On-Page Report (above) gives you a consolidated, page-specific digest of Google Analytics data (though it does also include our Google Tracker stats- a listing of all the various Google search queries that led traffic to the pages). You can expand and contract this report by clicking the tab at the top; each expansion reloads the Google Analytics data in real-time. One of the nicest features here is the Conversion Rate chart at the bottom, which shows the percentages of the page’s traffic that went on to complete any goal you’ve listed in Google Analytics, as well as compares that page-specific rate to the sitewide-rate. To get a similar report from Google Analytics, you’d have to run an advanced segment report to refine a page’s traffic report by a particular segment, in this case, only that traffic which included goal conversions (I demonstrated this in our newsletter on How to Use Google Analytics).
Running Routine Advanced Segmentation Reports
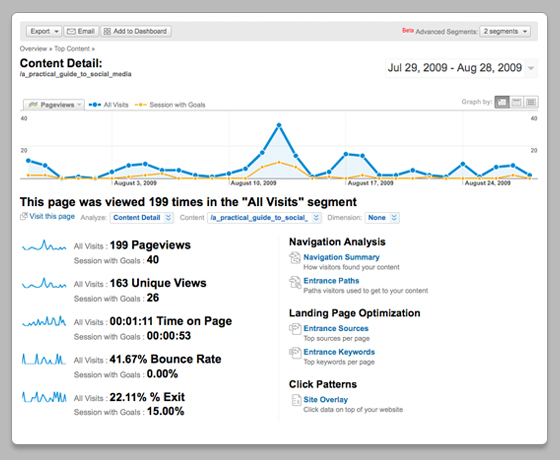
While the dashboard and on-page reports make our Website Management System the centralized, comprehensive tool it is today, it is important to note that it does not render Google Analytics obsolete. Technical limitations to Google’s Analytics API currently restrict data output to particular metrics and combinations of metrics, which means that you will still want to use Google Analytics to run custom and advanced segment reports. The screenshot above shows a very simple advanced segment report running for the landing page of our newsletter, A Practical Guide to Social Media. I’ve combined a month’s worth of traffic data for this page (the blue graph) with a report showing that 20% of its traffic over the past month led to one or more of our specified goal conversions (in orange)- either signing up for our newsletter, a webinar, or requesting a meeting. The spike around August 12th resulted from a link to our site from Smashing Magazine, which included us in it’s post on Useful Web Design E-Mail Newsletters. Because they were promoting our newsletter, there was also a spike in goal conversions for that traffic. Much of the traffic to this particular newsletter around that time was a result of the referral from Smashing Magazine. (On that note, this wouldn’t have happened if I hadn’t been using Twitter- more on that here, if you’re interested.)
A Uniquely Scalable System
But here’s something truly exciting: Because we built the dashboard to be seamlessly integrated with our CMS, and we custom build every website around this system, we can add new custom reports to the dashboard, or custom metrics to the on-page report, as our clients need them. And as Google’s Analytics API continues to be refined, there will be more possibilities in terms of adding the advanced segment reports you run most often to your dashboard, too. Third party applications cannot do this. They are restricted to a general offering because they do not have access to your site’s database, nor the ability to expand or tweak it’s functionality. The value of a centralized system is only as good as its ability to be refined or expanded based upon its user’s unique needs.
At the beginning of this article, I wrote that a centralized Website Management System unified three previously distinct areas: Content Management, Measurement and Project Management. We’re working on bringing the third area, Project Management, into the fold now, so I wanted to give our readers a preview of what is to come.
The New My.Newfangled.Com
Today, our clients who have initial projects in process can log in to our system and see links to their prototype, design layouts, and the development version of their site. It’s helpful, but beyond what I’ve listed, a client who can remember or bookmark those links has no compelling reason to return to their my.newfangled.com page. We believe that there is much, much more we could provide to our clients using that interface, and so we’ve designed a brand new one.
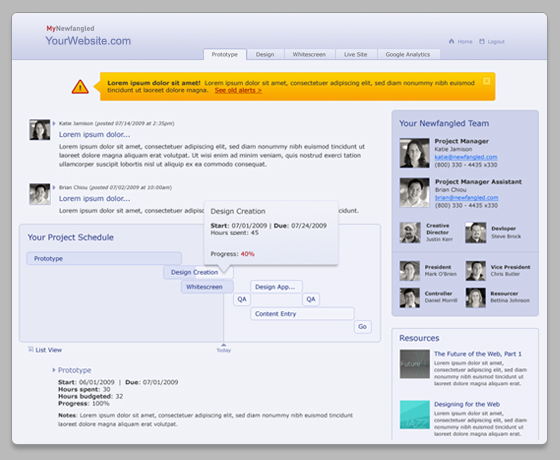
The new My.Newfangled.Com (shown above) includes the ability to access the prototype, design files, the development version of the site, and direct access to the client’s Google Analytics account through the tabbed interface at the top. On the right side of the page, we’re showing an overview of every Newfangled employee making up the project team and contact information for the Project Managers. Below, we’ve added a list of resources we believe will be helpful to our clients. These might be newsletters, blog posts, webinars, or other information.
In the main content column, we’ve added a display of messages added by our Project Managers, which might include reminders of specific deadlines, notes of key decisions made in the process, or other information pertinent to the project. Beneath is probably the most important addition, a project schedule display showing exactly where the project is today in terms of the overall process. Being able to see the project status in such a clear way will greatly reduce the possibility of confusion about deadlines and perhaps even the likelihood of missing one. For greater detail, we’ve included a list view of each project stage and its progress that can be expanded beneath the chart.
You may have also noticed the bright, orange alert across the top of the page. This would only appear if our System Administrator needed to plan for routine work on our development server which could require a brief, temporary lapse in access to the my.newfangled environment (the interface above, the prototype, design files or the development version of the site). In the event of this kind of maintenance, the alert would appear well in advance to make sure all of our client are aware of it.
The Future of Website Management
We’re greatly looking forward to an October release of the new My.Newfangled.Com, which will be the final piece to complete the new Website Management System we’ve been working on for the past year. Aside from the project management tools I’ve just reviewed above, the latest release, comprising the update to the CMS and the measurement dashboard and on-page reports, is available now. Our goal has been to create a system that is simple, yet comprehensive, centralized, yet incorporating various streams of data, and above all, one that truly enables its users to effectively cope with the complexity of managing their website. This is the future of Website Management.
Related Posts
-
This week, Chris and I discuss the ideas of marketers holding themselves accountable to the…
-


Chris Butler presented on "You, the Other Kind of Business Leader"...
-


Christopher Butler will be a keynote speaker at the 2015 ConvergeSE conference...