
In my last post in what is becoming series on measurement, I started off with my hypothesis that our company is like an ecosystem, “comprised of many areas of unseen activity” in addition to the sort of seen activity you’d expect (sales, individual projects, relationships, etc.). So, in trying to verify my hypothesis, I’ve been gathering data representing all kinds of unseen and unmeasured activity to see how it relates to the big picture as I’ve understood it so far. I started with looking at our blogging activity over the past three years and noticed that the months where we posted less loosely corresponded to what we tend to think of anecdotally as “busy” times for our company. That made me wonder- how else could I measure “busyness”? Looking at sales data wouldn’t quite do it, because those numbers would correspond to the beginning of a project, so the trendline of sales may not match up exactly with that of volume of work over time. However, looking at the volume of communication using our internal project management system might help me discern at trendline for “busyness.”
Unfortunately, there was no simple way to do this. Our system doesn’t have reporting tools that would tell me how many logs were completed for a particular period of time. However, since I receive an alert every time a log goes through our system, I realized that I could isolate those messages in my Gmail account and… count them one by one. Actually, I ended up counting them 50 by 50, since that’s the page limit in Gmail’s search results (see image at left). Needless to say, it took a while, but I did uncover some interesting things.
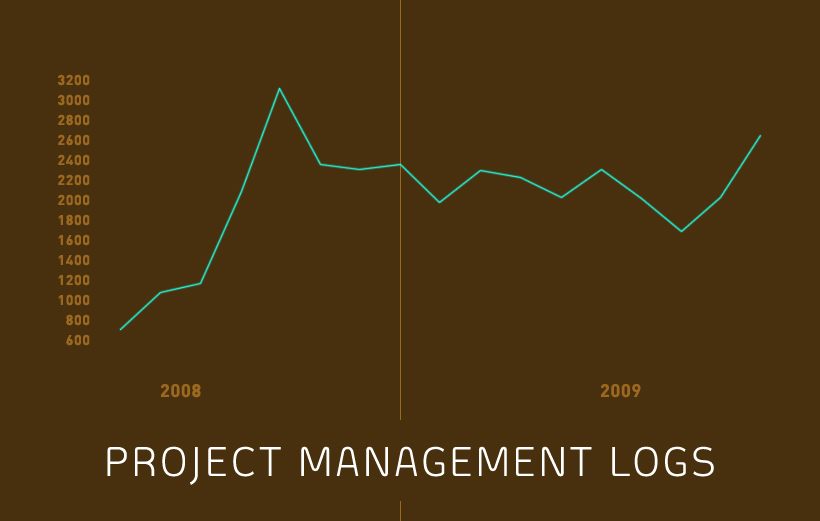
First, let me describe the metrics shown in the graph above. The vertical axis represents the number of individual logs posted by Newfangled employees to our project management system (these might be messages checking in on production progress, updating the task description, asking or answering questions, posting files, etc.). As you might imagine, a project of even minimal complexity would have many such messages, particularly as we have people collaborating on projects who work in separate offices. More obviously, the horizontal axis represents months over the past two years.
The first thing I noticed was the dramatic increase between August (1191 logs) and October (3132) of 2008. To put the number in perspective, October’s total averages to about 136 logs posted per day (there were 23 business days that month)! That’s in addition to all the phone and in-person conversations that occur here each day. In fact, we haven’t had a month with that level of communication volume since. I cross referenced this number with our sales from October of 2008, and it turns out that, in addition to the two new projects we signed that month, we also did 57 different new functionality upgrades to existing client sites. That was the highest number of upgrades in one month for the entire year. With that in mind, 3132 project logs makes much more sense. We were busy.

Here are some Newfanglders. They may not look like it, but some of them were probably communicating using our project management system the moment this picture was taken.
However, I then thought to cross reference the lowest month shown, June of 2008, with the sales from that month to see if they were correspondingly lower. While the number was less (3 new projects signed, 43 new functional upgrades), the overall communication volume wasn’t proportionate. It should have been a higher number if there was a direct correlation. Especially since the previous month, May of 2008, we’d signed 7 new projects and done 55 functional upgrades. There would certainly be some bleed from May to June in terms of project communication. While October, 2008 is the peak, the numbers tend to level off in the mid-2000’s after that, though there is another peak in October, 2009. I don’t think sales are the complete explanation for this, but I do have a couple of ideas about other factors that could.
The first factor is the number of employees using the system. Between May and October of 2008, we hired 4 new employees- three Project Manager Assistants and one Resourcer. These roles were essential to a new system we’d been establishing to make sure our service remained excellent while the complexity of our work increased. The Project Management teams use this system constantly to communicate and log project progress, and the Resourcer is constantly checking in on every task to watch progress and utilization. No wonder the number jumped so drastically! The other factor helps to explain the pattern, in that we are again seeing a jump this October despite not having a corresponding growth in personnel- that factor is the pre-holidays rush. This happens every year, where existing clients and new prospects are eager to get work completed or scheduled before the holidays and especially the new year. There’s something about these calendar landmarks that put the pressure on, not to mention the common need to allocate funds before the end of the financial year.
This was an interesting exercise. Little by little, measuring these “peripheral” data sets is giving me a much better sense of the big picture.
Related Posts
-


Christopher Butler will be a keynote speaker at the 2015 ConvergeSE conference...
-


Chris Butler will be speaking at the concluding session of the AIGA's Web101 course...
-
Chris Butler is MC'ing at this year's Hopscotch Design Festival...